Factors of Domestic Violence in Victoria
I was looking through the Victorian Police’s crime data set and what caught my eye, other than an ostrich being stolen in 2023, was the domestic violence (DV) dataset. It made me wonder - what were the causal factors of DV in Victoria and could we model them?
To compare the years fairly, the DV data was analysed relative to the population. The ABS’s data was used to normalise any metrics as needed.
A First Look
To begin, here is the dataset:
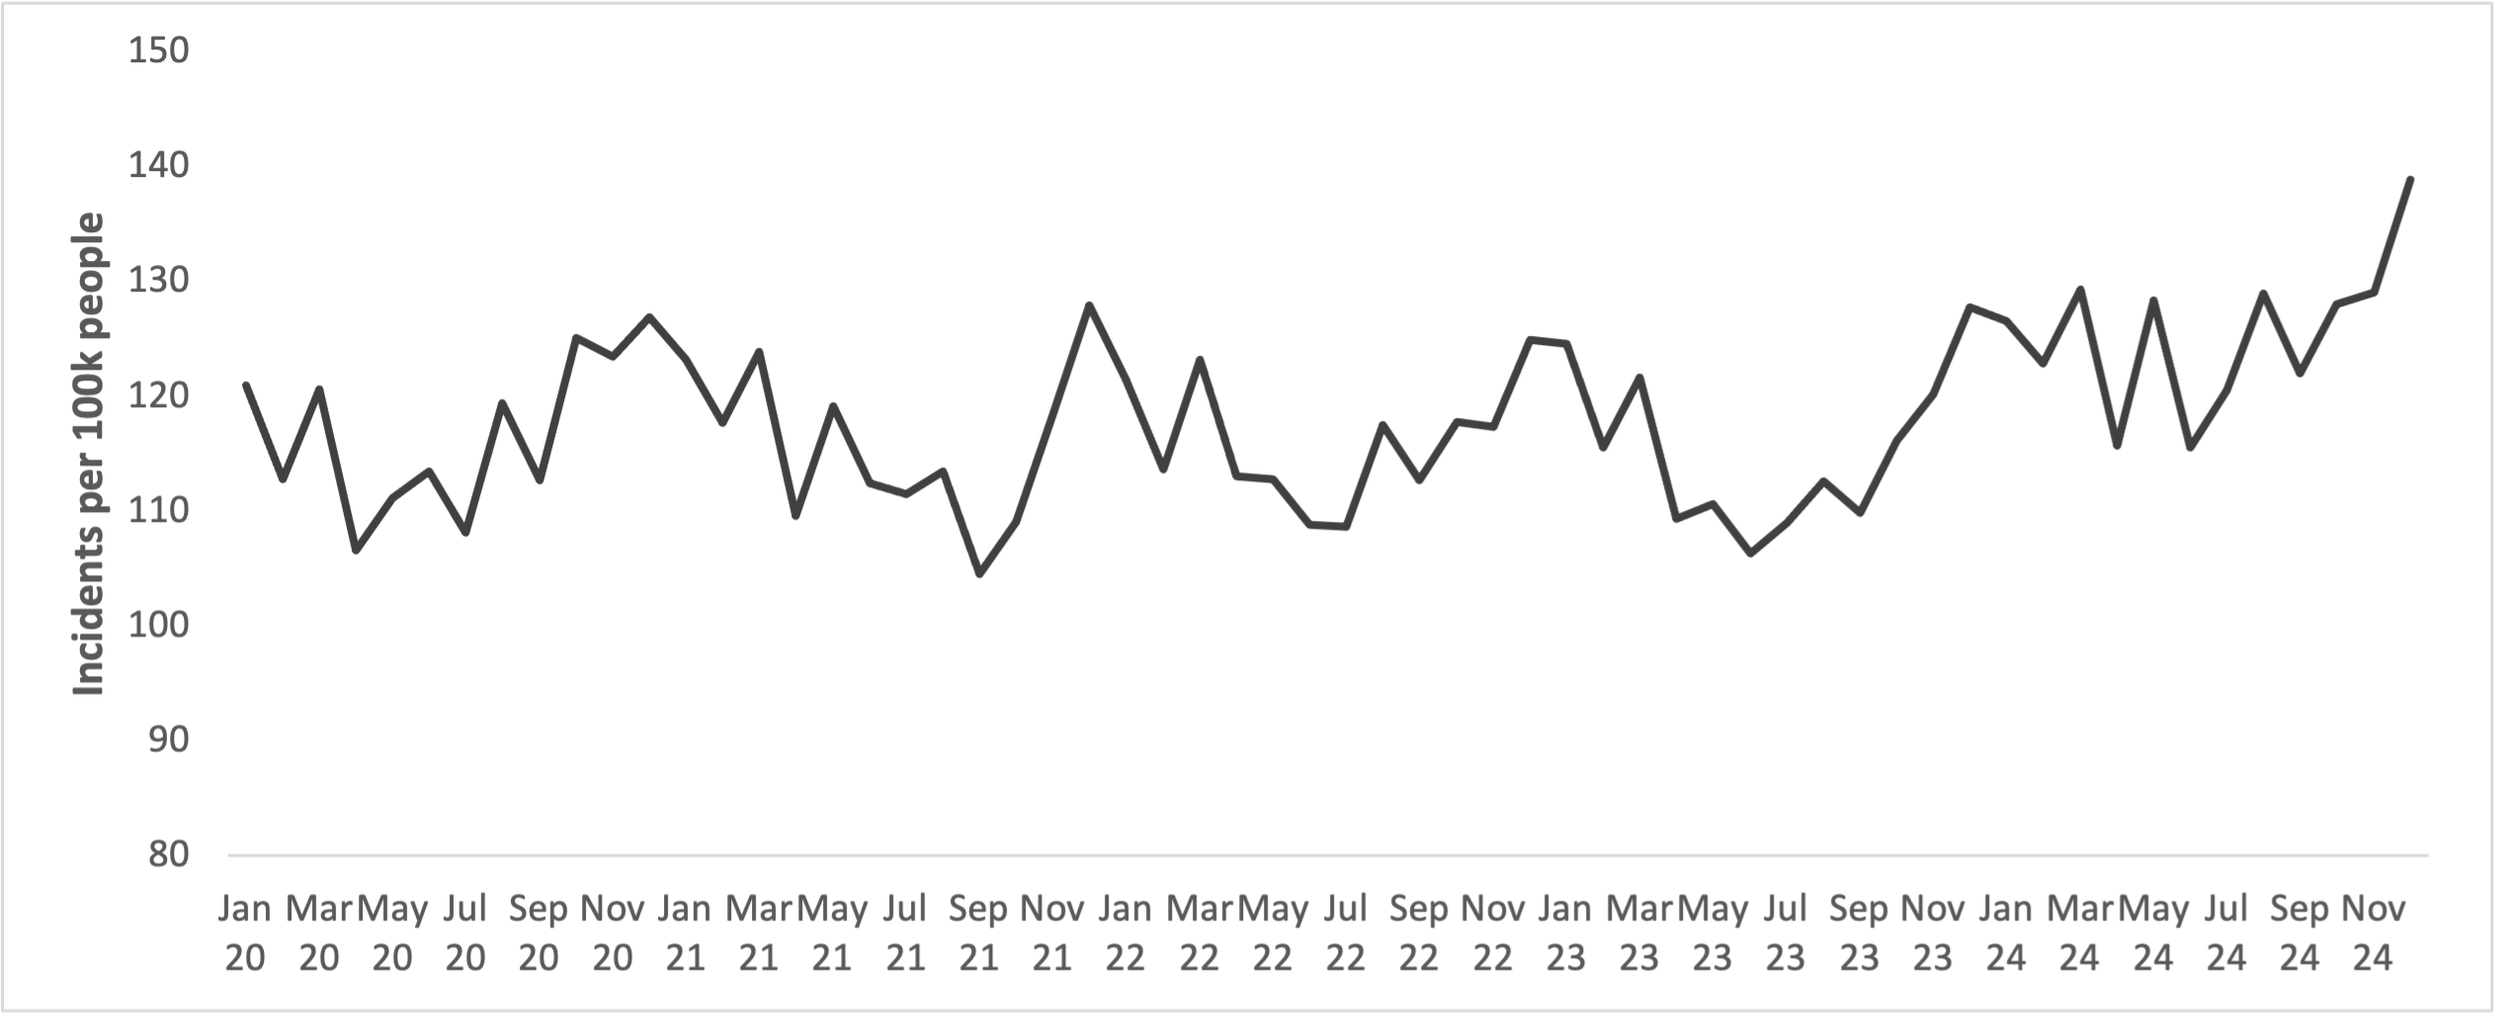
A few things stick out, notably the increase towards the end of 2024 and what appears to be a yearly cyclical trend. Now if the data does in fact go through a yearly pattern, then in theory, it should map onto a sinusoidal wave.

Using linear regression, the following formula was derived:
DV = 5.67 * COS(n*pi/6) - 2.17 * SIN(n*pi/6), where n is 0, 1, 2, 3… corresponding to Jan, Feb, Mar, Apr…
It’s a rough fit but with an R-value of 0.58 it moderately tracks with the data. Given that the peaks appear to be in summer, a natural continuation was to compare it with historical weather data.
Trending with weather
With the help of the Bureau of Meteorology’s weather data, the monthly mean maximum and minimum temperatures could be overlaid with the domestic violence counts:

Similar to our sinusoidal wave, it’d be worthwhile to model the data. However, as the graph demonstrates, the max and min temperatures are very highly correlated. In fact with an R value of 0.97, they show near-linear dependence! Mean max temp was therefore arbitrarily chosen and the end result was the following function with an R value of 0.57:
DV = 1.02 * max_temp + 97.35
Unemployment
Another factor for domestic violence is unemployment. However when comparing the ABS’s monthly unemployment data, there was no meaningful correlation and the data had next to no bearing (R < 0.065) on DV incidences. Even when broken down by gender or analysed in a seasonally-adjusted format to smooth out spikes due to seasonal trends such as Christmas hiring, the correlation was even weaker (R < 0.038).

Perhaps the effects of unemployment took some time to ripple through the population. After all, being unemployed for 1 month is less of an aggravating factor than 6 months. However, this also didn’t appear to be found in the data. Even when comparing data time lagged by 1-6 months, there was still very weak correlation with DV (R < 0.2).
This finding could make sense if we consider that instead of societal trends in unemployment, an individuals socioeconomic status could make unemployment a more important variable.
Substance Abuse
As a proxy for substance abuse, the Australian Institute of Health and Welfare’s data on ambulance callouts for drug-related incidents was used.
The linear correlation of each substance with our DV counts is shown below:

Ordered from highest to lowest correlation.
As can be seen, the most correlated factors are alcohol, amphetamines and heroin.
Given that they have the highest correlation, these 3 substances were integrated into our existing temperature data model.
Along with the temperature data they were z-normalised so that their coefficients would represent their relative influence on domestic violence numbers.
These 4 variables produced the following equation with a strong R of 0.80:
DV = 2.64*alcohol - 0.52*amphetamines + 1.09*heroin + 3.28*max_temp + 116.22
However, this regression had an issue. For amphetamines and heroin, their coefficients had p-values of 0.66 and 0.13 respectively. Compared with that of 0.034 and 0.00022 for alcohol and max temp respectively, these are too large to meet our threshold of P < 0.05. For this dataset, there’s insufficient evidence that they meaningfully contribute to our model and as a result, they were both excluded. Although now a moot point, it is curious that amphetamine’s negative coefficient would have implied that its use correlated with a decrease in DV cases.
Our new equation is: 3.59*alcohol + 2.29*max_temp + 116.22
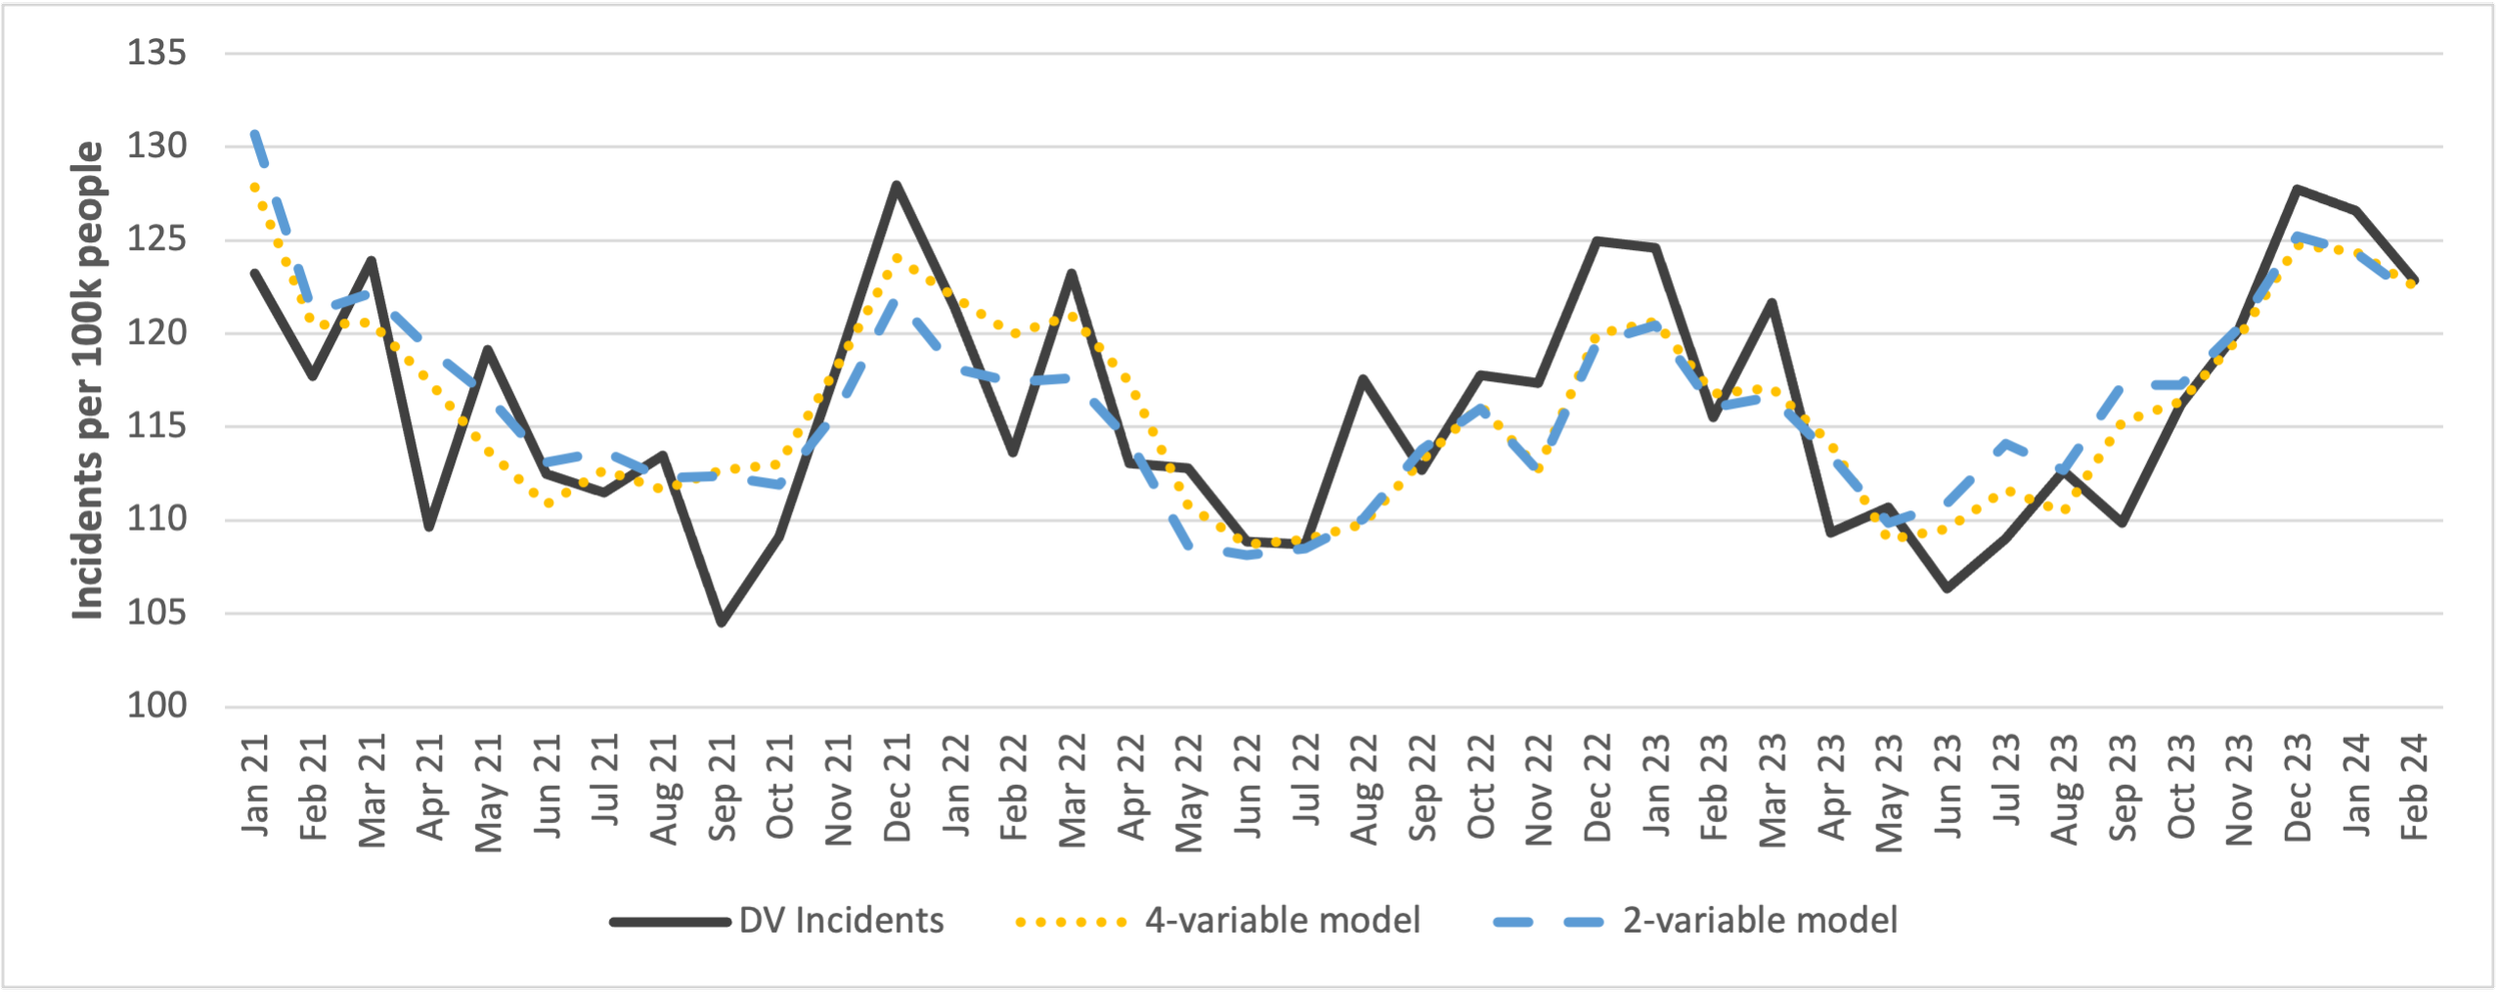
With an R of 0.787 it has a slightly weaker correlation with our dataset, however in exchange we can be confident of the explanatory power that it does have. For a comparison I’ve provided both our initial 4-variable model and our new 2-variable one graphed over the DV dataset below:
Age ANalysis
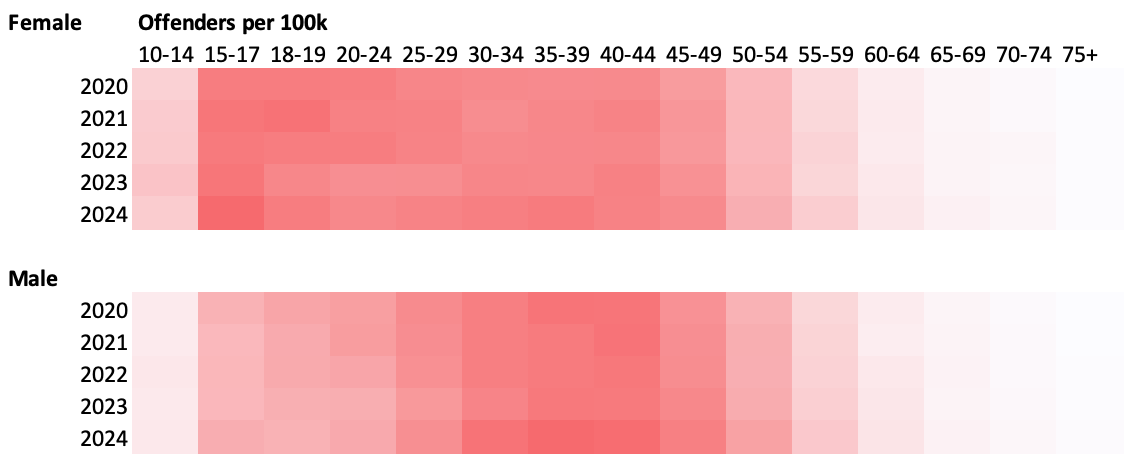
Now that we have a model for our data, it’s time to explore another Victoria Police crime data set. Namely, its breakdown of both victims and perpetrators by age and gender for police domestic violence callouts. Given that at the time of each call out, the charged party is yet to be convicted in court, VIC Police uses the neutral term “other” to refer to them. However, we’ll be using the “others” as a proxy for perpetrators with the assumption that it still represents the larger societal trends.
For the perpetrators we can see that they peak for 15-17 year old females and remain relatively high up through into middle age, dropping off afterwards. By contrast, men peak over the span of the 25 - 50 year old bracket. Although not visualised here, it’s worth noting that men were 2.8x more likely to be perpetrators than women.
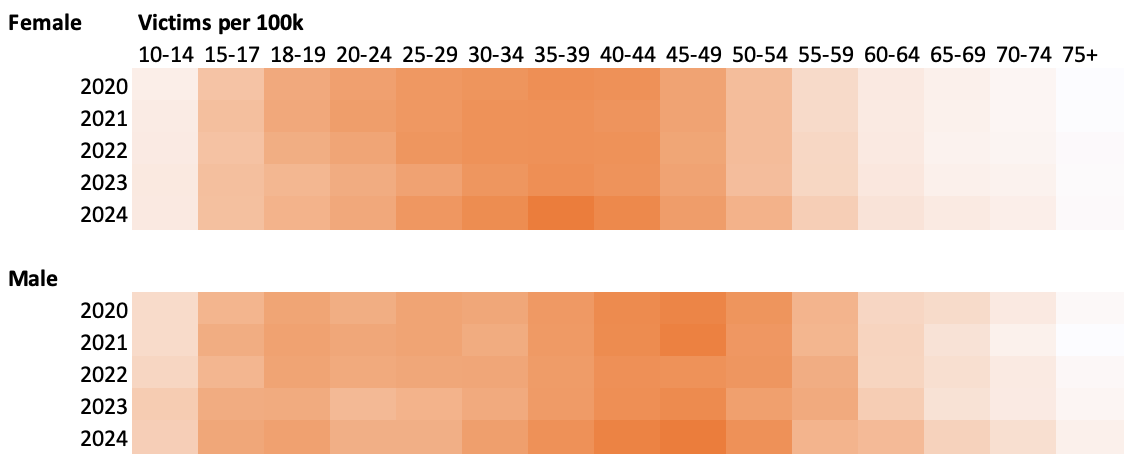
For female victims, those in their 30s were most affected with numbers decreasing on either side. For men, the peak was closer to 45-49 and similarly dropped, although the decline was more gradual towards the younger years. In all 4 datasets, the trends have remained rather consistent over the years. Of additional note was that 74% of victims were female.
The yearly data was averaged out to show the disparity between various ages and genders below. It is clear that women are significantly more affected by DV, with men being the primary perpetrators. These extremities are clearest throughout the adult years.

Where to from here
It’s clear that alcohol and the summer high temperatures are correlated with domestic violence in Victoria. In addition, the majority of perpetrators and victims are male and female respectively.
The dataset’s 5-year span of 2020-2024 was a very abnormal time for the world. With the pressure of COVID lockdowns, domestic violence was on the rise globally. A more detailed pre-2020 data for Victoria could better reveal its direct impact on the state.
As 2025 runs to a close and the year’s data becomes available, there will be further opportunities to evaluate the model. In addition, it could be worthwhile to further slice unemployment data in terms of socioeconomic and geographic factors to see its impact on domestic violence.